

You might wonder why I’m discussing data organization in such detail. The reason is simple: even the smallest oversights, like neglecting proper data structuring, can lead to significant headaches down the road. In this post, I delve into my approach to data structuring and the reasons behind it.
Files & Directories over SQL
I choose to store my raw data in files and directories, not because I dislike SQL, but because I recognize the data’s numerous inaccuracies and poor data types. It’s not yet ready for SQL and downstream systems. Moreover, the cross-validation cleaning we’ll perform would be challenging using SQL procedures alone. Therefore, my approach involves ingesting, processing, and extracting clean data using Python, which I then store in a SQL database. In a professional setting, I’d rely on expensive data vendors who provide well-organized, high-quality data requiring minimal adjustments—perfect for SQL procedures.
Directory Structure
I’ve dedicated considerable time to contemplating how I want to structure my directories. Anticipating the challenges of future changes, I’ve meticulously designed my raw data directory layout. This structure resides on a 4TB drive, with 2TB - 3TB allocated for storing all my raw data. If storage space is limited, I recommend thoughtful partitioning across multiple drives. Personally, I maintain a separate raw data drive from my clean data drive. Why? Because cleaning historical data is a one-time task, and perhaps a touch of my inner perfectionism plays a role.
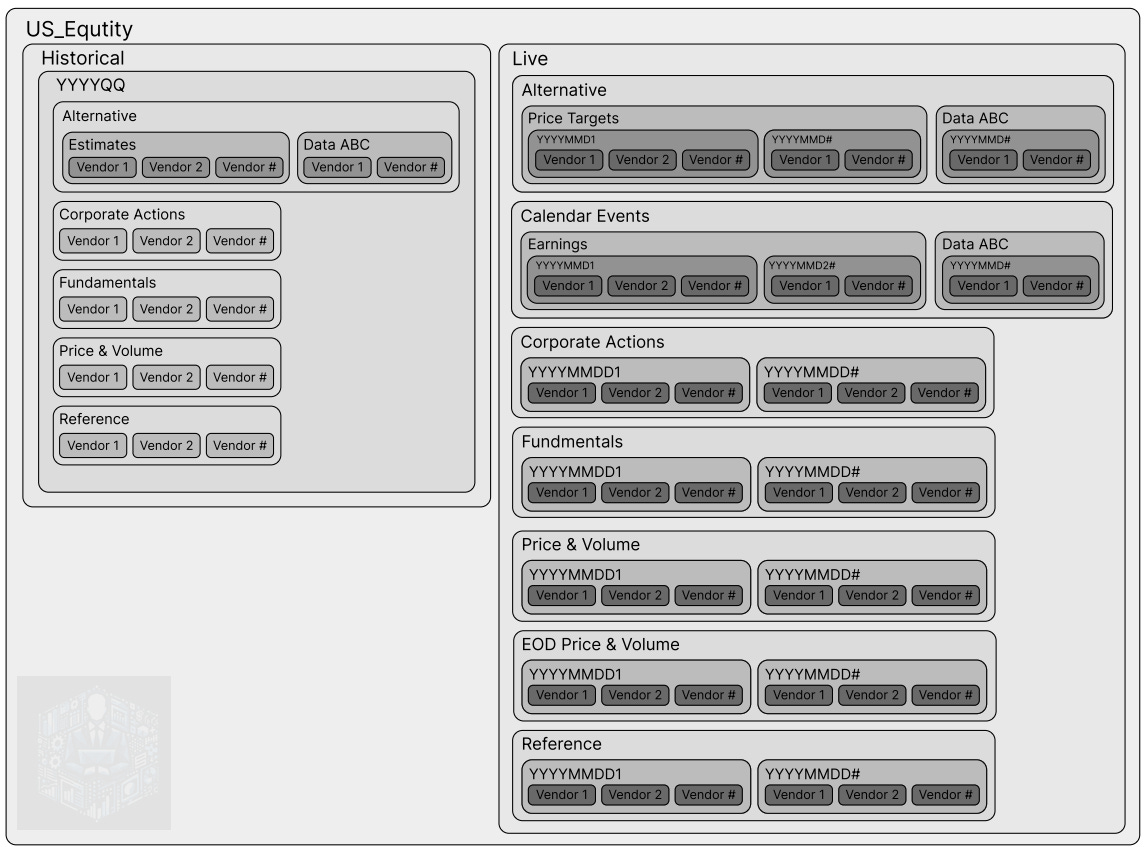
I organize my data first by market (e.g., US Equities) and then by historical versus real-time data. Let’s break it down:
Historical Data Directory:
I categorize directories within this section by the year and quarter when I began collecting the data. For instance, if I start gathering data on May 21, 2024, I create a directory called “2024FQ2.” This way, I can track when I pulled specific historical data.
Next, I further categorize directories by data type. Most data type directories follow a similar structure, except for the “alternative” category. Within each data type directory, I organize raw data into vendor-specific subdirectories because each data vendor provides data in a different format or with varying cuts (e.g., by ticker, date, page number, or bundled files).
Real-Time (Live) Data Directory:
Similar to historical data, I categorize directories by data type. However, for real-time data, I also organize by the date when we pulled the data. This ensures clarity and easy retrieval.
Again, I maintain vendor-specific subdirectories. The only additional categories in real-time data are:
End of Day (EOD) Price and Volume Directory: Records price and volume data after the market closes.
Calendar Events Directory: Logs upcoming events such as earnings reports and analyst investor days.
This meticulous organization prevents data confusion and streamlines retrieval. When dealing with terabytes of data and limited time, efficiency matters!
Coming up next
We’re embarking on our inaugural data ingestion task. Specifically, our goals are to swiftly load data while avoiding API rate limits, set up alerts for any issues, and thoroughly verify the results post-loading.